Posts

Showing posts with the label excel business intelligence

Webinar on MS Excel BI Reporting Simplified: PowerPivot and PowerQuery

Image
If you work with data, you’re likely already familiar with the common frustrations with Microsoft Excel like size limitations and manually entering data from multiple sources. Our upcoming webinar discusses how to use PowerPivot and PowerQuery that solve all of these issues, right inside Excel. The webinar covers the following key areas: ·          How to activate/install Excel PowerPivot and PowerQuery—free tools from Microsoft ·          Creating relationships between different datasets in PowerPivot ·          Importing data into Excel from an array of external sources LEARNING OBJECTIVES Excel Power Pivot and Power Query complement each other. Power Query in Excel is the recommended experience for discovering, connecting, and importing data. Power Pivot is great for modeling the data you’ve imported. WHO WILL BENEFIT Business owners CEO's /...

Advanced Pivot Tables: Analyzing Data, Spotting Trends and Making Key Business Decisions

Image
Advanced Pivot Tables OVERVIEW Pivot Tables are one of the most powerful tools in  Excel’s Data Analysis  and  Business Intelligence (BI)  armory. With just a few clicks of the mouse (and no complicated formulas!) you can quickly and easily build reports and charts that summarize and analyze large amounts of raw data and help you spot trends and get answers to the important questions on which you base your key business decisions. WHY SHOULD YOU ATTEND Learning how to create Pivot Table in Excel is one of the must-have skills for anyone who needs to use Excel to quickly build reports and summaries. This Excel Pivot Table training will enable anyone who is familiar with the basics of Pivot Tables to take their skills and knowledge to the next level. AREAS COVERED Calculating month-on-month difference Calculating a running/cumulative total Displaying a unique count Using formulas to create additional calculated items Slicers ...

Excel - Pivot Tables 101: Building a Reporting Tool with Pivot Tables (Part 1)

Image
OVERVIEW Pivot Tables are one of the most powerful tools in Excel’s data analysis and  Business Intelligence  (BI) armory. With just a few clicks of the mouse (and no complicated formulas!) you can quickly and easily build the reports, dashboards and charts that help you summarize, analyze, interpret and understand your data which in turn helps you spot trends and get answers to the important questions on which you base your key business decisions. Pivot Table in Excel has a reputation for being complicated and scary but by attending this Microsoft Excel training , you’ll be pleasantly surprised at how easy it is to use and create them. pivot table in excel WHY SHOULD YOU ATTEND From global enterprises to early-stage startups and small businesses, people everywhere use Pivot Tables to see and understand their data. Learning how to create Pivot Tables is one of the must have skills for anyone who needs to use Excel to quickly build reports and...

Online Webinar on Excel as a Business Intelligence Tool – How to create flexible summary reports using Pivot Tables and Charts – Training Doyens

Image
OVERVIEW   Many people struggle with how to create Pivot Tables, or maybe they don’t even know what they can do, or maybe they think they are too difficult. I’m delighted to invite you for our upcoming webinar where Tom Fragale discusses how to take all of your raw data and quickly turn that data into easy to use flexible summary reports using Pivot Tables and Charts . The webinar provides a clear and deep understanding about: ·          Creating and managing Pivot Tables. ·          Creating custom calculations ·          Creating daily, monthly, quarterly and yearly summaries LEARNING OBJECTIVES In this webinar, you will learn how to take all of your raw data and quickly turn that data into easy to use flexible summary reports using Pivot Tables and Charts. We will start with the basics and built up to more complex pivot tables. WHO ...

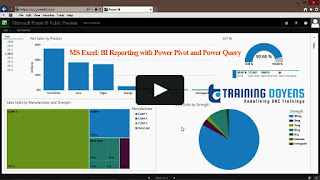
MS Excel: BI Reporting with Power Pivot and Power Query (Learn about Data Models, DAX formulas and more.)

Image
OVERVIEW If you work with data, you’re likely already familiar with common frustrations with Microsoft Excel like size limitations and manually entering data from multiple sources. Luckily there are two Microsoft tools- Excel PowerPivot and PowerQuery —that solve ALL of these issues, right inside Excel. No Access databases or IT department help needed. With imports of 1-million-plus rows of data sets from virtually any source and the ability to save query definitions, you can completely overhaul your reporting and analysis workflow. WHY SHOULD YOU ATTEND Attend the webinar if you use Microsoft Excel on a regular basis, and want to be more efficient and productive. excel business intelligence AREAS COVERED How to activate/install Excel PowerPivot and PowerQuery—free tools from Microsoft Learn about Data Models Creating relationships between different datasets in PowerPivot Importing data into excel from an array of external sources Learn about DAX f...

MS Excel: BI Reporting with Power Pivot and Power Query (Learn about Data Models, DAX formulas and more.)

Image
OVERVIEW If you work with data, you’re likely already familiar with common frustrations with Microsoft Excel like size limitations and manually entering data from multiple sources. Luckily there are two Microsoft tools- Excel PowerPivot and PowerQuery —that solve ALL of these issues, right inside Excel. No Access databases or IT department help needed. With imports of 1-million-plus rows of data sets from virtually any source and the ability to save query definitions, you can completely overhaul your reporting and analysis workflow. WHY SHOULD YOU ATTEND Attend the webinar if you use Microsoft Excel on a regular basis, and want to be more efficient and productive. excel bi reporting AREAS COVERED How to activate/install Excel PowerPivot and PowerQuery—free tools from Microsoft Learn about Data Models Creating relationships between different datasets in PowerPivot Importing data into excel from an array of external sources Learn about DAX formulas ...